
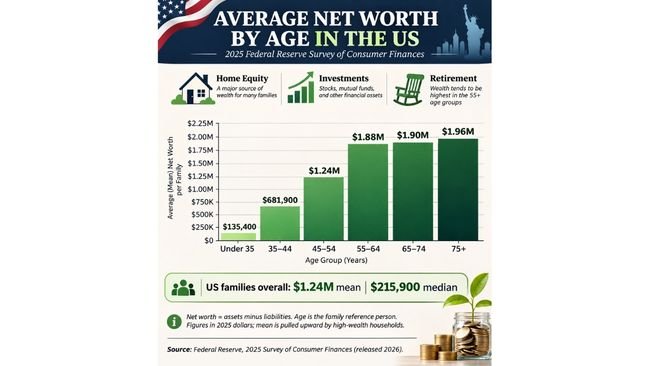
The median US household has a net worth of about $216,000, according to the Federal Reserve’s 2025 Survey of Consumer Finances, released on October 9, 2026. The typical net worth rises steeply with age, from about $33,000 for households headed by someone under 35 to about $505,000 for households headed by someone 75 or older. Averages are far higher than medians at every age, because a relatively small number of very wealthy households pull the average well above what a typical family actually holds.
Understanding the difference between these two numbers, median and average, is probably the single most useful thing a reader can take from this kind of data. The Federal Reserve’s own summary makes clear that the overall mean net worth in the 2025 survey is about $1.23 million, nearly six times the median of around $216,000. If you only ever see the average figure quoted in a headline, you are likely to come away with an inflated sense of what a typical household actually owns.
Median net worth by age (2025 Fed data)
| Age of household head | Median net worth (2025 survey) | Median in the 2022 survey |
|---|---|---|
| Under 35 | $33,000 | $39,040 |
| 35 to 44 | $155,600 | $135,300 |
| 45 to 54 | $253,700 | $246,700 |
| 55 to 64 | $411,900 | $364,270 |
| 65 to 74 | $431,300 | $410,000 |
| 75 and older | $504,900 | $334,700 |
The 2025 figures are in 2025 dollars. The 2022 figures are as published at the time, so the two columns are not adjusted against each other for inflation, and the year-over-year changes shown here are not exact real-dollar comparisons. Net worth means total assets, everything a household owns, minus total debts, everything it owes.
What changed since 2022?
- The overall median rose to about $216,000 (different reports give $215,900 and $216,100 depending on rounding), up from $192,700 in the 2022 survey as originally published.
- The median for households under 35 fell 23% over three years, to $33,000, according to reporting based on the Associated Press’s coverage of the new survey.
- The average net worth of households 75 and older rose 10% to $1.96 million, a figure far above the median for that same age group.
- The median net worth of the richest 10% of families rose 31% to $3.6 million between the 2022 and 2025 surveys, a sharper gain than most other groups saw.
Those four facts together tell a fairly consistent story: wealth at the very top of the distribution, and among older households that already held substantial assets, grew faster than wealth for younger households over this three-year period. That pattern is consistent with a period in which stock markets and home values, assets disproportionately held by older and wealthier households, rose a great deal, while younger households, who are more likely to rent and to hold debt rather than appreciating assets, saw less benefit and in some cases outright declines.
Why is the average so much higher than the median?
The mean is pulled up by a relatively small number of very wealthy households at the top of the distribution. The overall mean in the 2025 survey is about $1.23 million, nearly six times the $216,000 median. The pattern repeats within age groups: for the under-35 group, the average is about $135,400 to $135,700 against a median of only $33,000, meaning the typical young household holds roughly a quarter of what the average figure implies.
For almost every practical purpose, from comparing your own finances to planning for retirement, the median for your age group is the fairer and more useful benchmark. The average answers a different question, essentially “how much total wealth exists per household in this group,” which is heavily shaped by billionaires and multi-millionaires who happen to fall into that age bracket, rather than “what does a typical household in this group actually have.”
How does housing change the picture?
One analysis built on the Fed data found that the median renter has about $10,600 in net worth, a striking contrast to the hundreds of thousands held by typical homeowners in the same age bracket. Among households under 35, only about 36% own a home at all. Owners in that age group have a median net worth near $180,000, while renters of the same age sit around $12,000.
That gap is one of the clearest illustrations of how housing tenure, not just age, shapes a household’s net worth. Two 30-year-olds with identical incomes can end up with wildly different balance sheets depending on whether one of them bought a home years ago and built equity through a rising housing market while the other continued renting.
Net worth for ages 30 to 34
The same analysis of the Fed data puts the median for households aged 30 to 34 specifically at about $63,800 and the average at about $201,400. That sits comfortably above the broader under-35 median of $33,000, a reminder that even within a single age bracket like “under 35,” net worth climbs noticeably as people move from their early twenties into their early thirties, pick up more years of earnings, and, for some, begin building home equity.
How to use these numbers
- Find your age group in the table above and compare your own net worth with the median for that group, not the average, since the median better reflects what a typical household in your situation actually holds.
- Add up your assets, savings, investments, retirement accounts, and home equity, and subtract all of your debts, including mortgages, student loans, and credit card balances, to arrive at your own net worth figure.
- Check your rough percentile if you can. For ages 35 to 44, one analysis puts the 75th percentile at about $470,000; a 40-year-old with $300,000 in net worth would sit at roughly the 67th percentile for their age group, according to SuperMoney’s analysis of the data.
- Remember that the survey measures households, not individuals, and that net worth varies enormously with housing tenure, debt load, family size, and where someone lives, so a single national median is a starting point for comparison, not a verdict on anyone’s financial situation.
Frequently asked questions
What is the average net worth by age in the US? The 2025 Fed survey puts the median at $33,000 for under 35, $155,600 for 35 to 44, $253,700 for 45 to 54, $411,900 for 55 to 64, $431,300 for 65 to 74, and $504,900 for 75 and older.
What is the median net worth of a US household? About $216,000 in the 2025 survey, released October 9, 2026.
What is a good net worth at 40? The median for ages 35 to 44 is $155,600. A figure above that puts a household ahead of the typical household in its age bracket, though “good” ultimately depends on individual goals, debt, and circumstances.
Why is average net worth higher than median net worth? A relatively small group of very wealthy households raises the average well above what a typical household holds. The overall mean is about $1.23 million, compared with a $216,000 median.
How often is this data updated? The Federal Reserve publishes the Survey of Consumer Finances every three years. The 2025 edition, released October 9, 2026, is the latest.
Does net worth include retirement accounts? Yes. The Fed’s definition of net worth includes retirement savings such as 401(k)s and IRAs as assets, alongside other financial holdings, real estate, and business ownership, minus all liabilities.
Why did net worth for under-35 households fall? Reporting based on the survey points to a combination of lower homeownership rates, a weaker starting position for that group heading into the survey period, and debt loads that grew faster than assets for many younger households.
Sources
- Kiplinger: Average net worth by age (Fed 2025 data)
- SuperMoney: Net worth by age, 2025 survey
- Compound Ladder: Average net worth by age in America (2026 data)
- Investment Executive (AP): Americans 75 and older are the wealthiest age group
- Click On Detroit (AP): Fed survey finds 75 and older wealthiest
- Nasdaq (Motley Fool): Net worth by age, 2022 survey
Figures come from published summaries of the Federal Reserve’s Survey of Consumer Finances. Check the Fed’s own tables for exact values.
